A frustrated customer shares their story online. It goes viral. Not because the product failed but because the experience did. That’s what sticks. Today, people don’t just buy what you sell; they buy how you make them feel.
2026 belongs to brands that get CX right. Customer-obsessed companies grow revenue 41% faster, profits 49% faster, and retain customers 51% better than those that aren’t (Forrester Research).
Yet, most teams are still flying blind. They track surface-level metrics and miss what actually keeps customers coming back. That’s where the real gap lies.
To close it, you need better visibility into what your customers feel, expect, and remember. Because what you don’t measure, you can’t improve or scale.
This blog breaks down the key customer experience metrics you need and why they’re central to your customer data strategy.
What is Customer Experience Measurement?
Measuring customer experience is a structured process of tracking and acting on data from customer interactions. It gives you actionable insights into what’s working and where expectations are not being met.
At its heart, CX measurement captures the voice of the customer, reflecting both the numbers and the nuances. It helps you move beyond assumptions and start answering the questions that truly matter:
- Are your customers satisfied after support interactions?
- Where do friction points exist across channels?
- What drives repeat business or churn?
However, this goes beyond merely gathering feedback forms. It revolves around converting genuine experiences into valuable data that drives more informed choices and aligns with your business objectives.
Important aspects of customer experience measurement include:
- Sentiment assessment: Comprehending the emotional quality of customer responses.
- Tracking customer journeys: Charting experiences throughout various lifecycle stages.
- Behavioral metrics: Monitoring how customers engage with your digital platforms.
- Service-level metrics: Gauging performance indicators such as first response time or resolution rate.
The goal is clear: transform each touchpoint into a source of insight. When you measure well, you serve better and retain more customers.
Why Measuring Customer Experience Is Harder Than It Seems
Measuring customer experience (CX) may sound simple, but it’s quite complicated.
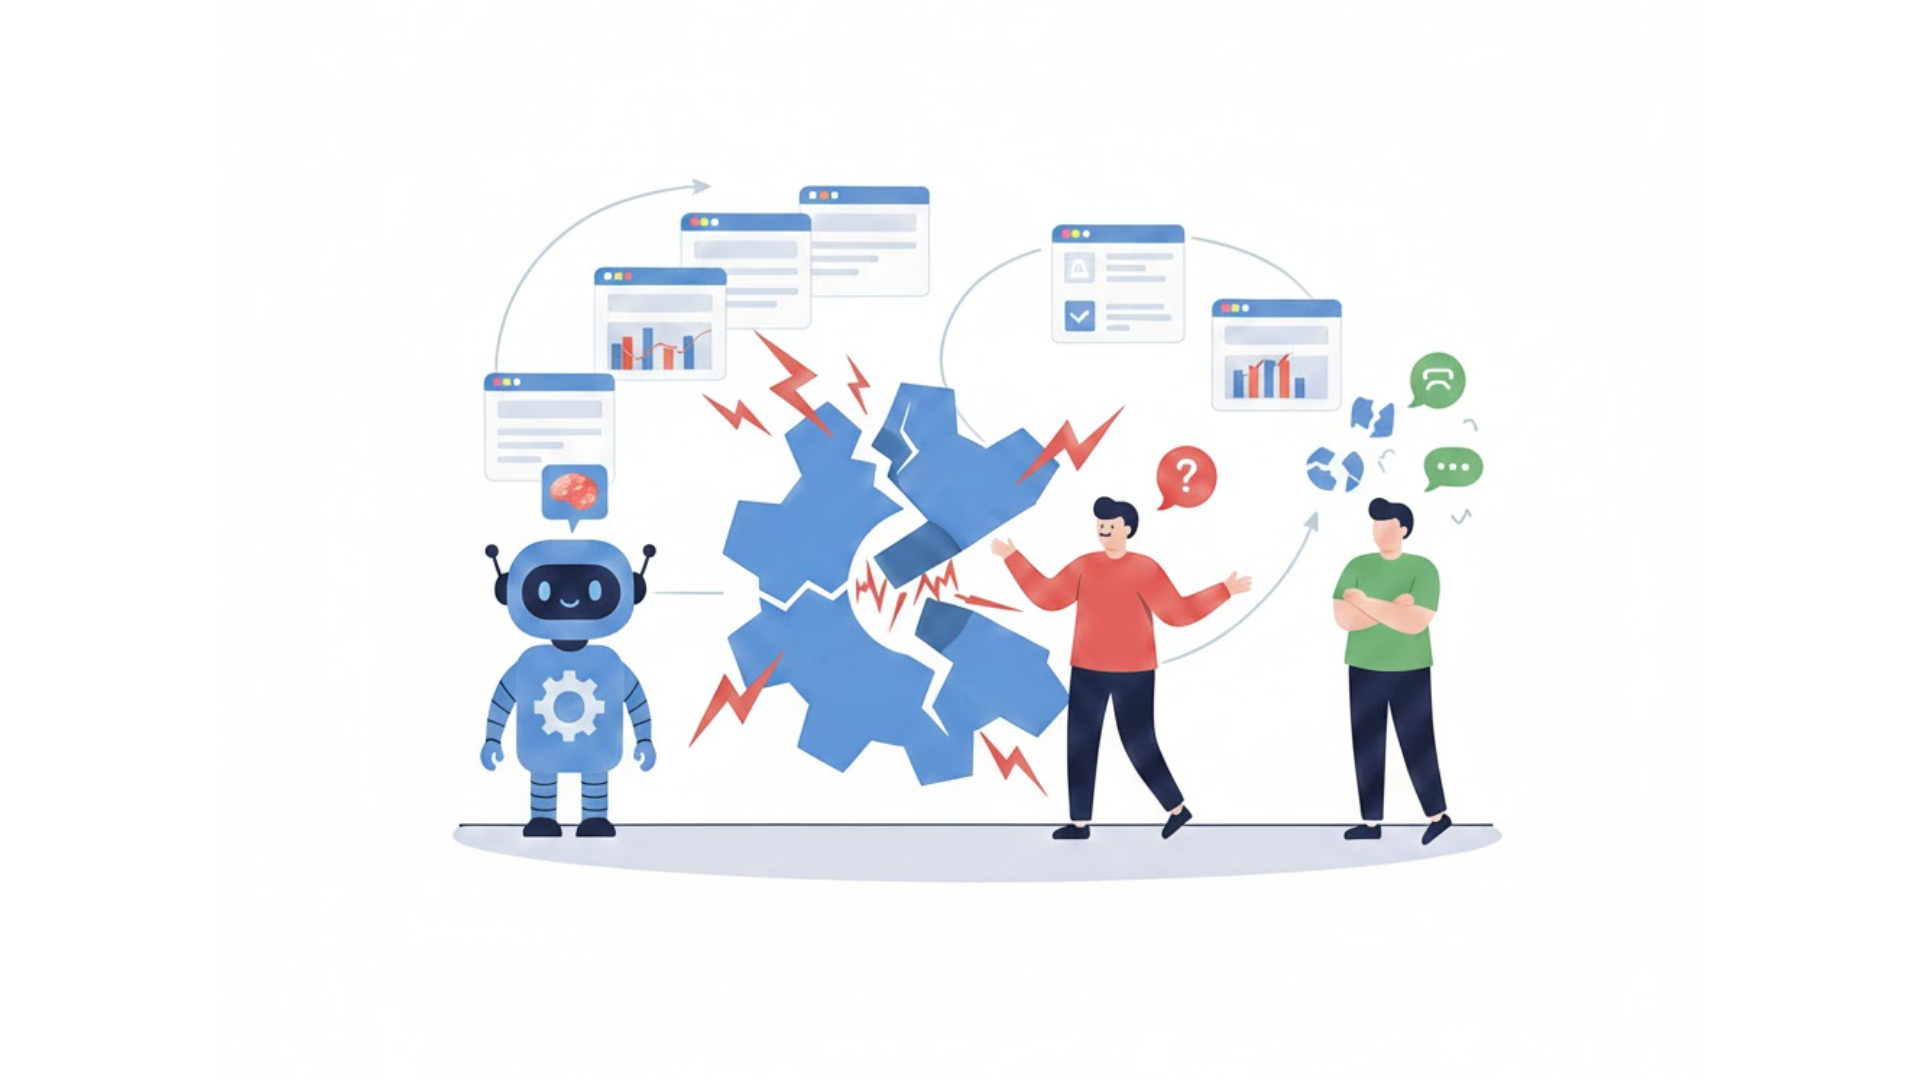
You encounter numerous touchpoints and fragmented systems. No single channel, such as chat, email, social, or phone, provides the complete picture. Piecing together these pieces of information is a big challenge.
Here’s what often gets in the way:
- Disconnected data sources: Your teams use various tools that fail to interact with each other.
- Divergent metrics: While one team measures Net Promoter Score (NPS), another concentrates on resolution time.
- Absence of immediate intelligence: Before you can identify a CX gap, the harm is inflicted.
- Restricted context: Figures alone cannot clarify why clients experience frustration or satisfaction.
With the expansion of support operations, the complexity also increases. Lacking a cohesive perspective, your insights remain partial, and your customer experience suffers as a result.
This is the point at which a cohesive customer experience platform stands out. A committed CX solution integrates all your data (interactions, feedback, and behavior) in a single place.
Using a consolidated customer experience platform, you can:
- Monitor the entire customer journey, rather than isolated engagements.
- Examine trends and issues across different channels.
- Get contextual, real-time insights to improve support at the moment.
- Build workflows that connect support outcomes to business goals.
You don’t need more data; you need better visibility. The right system turns complexity into clarity.
The Difference? Customer Experience Metrics vs. Customer Metrics
Customer metrics and CX metrics may appear alike, but they have distinct purposes.
Customer metrics track what customers do. They include:
- Purchase history
- Average order value
- Upsell/cross-sell rate
- Customer Acquisition Cost (CAC)
These help you comprehend profitability and trends within your customer group.
Customer experience metrics, on the other hand, concentrate on customers’ feelings during their interactions. They capture satisfaction, ease, and emotional response. Common CX metrics include:
- Net Promoter Score (NPS)
- Customer Satisfaction (CSAT)
- Customer Effort Score (CES)
While customer metrics show what is happening, CX metrics reveal why it’s happening. Both are important, but only CX metrics help you fix friction and elevate support quality.
To build a truly customer-first strategy, you need to connect the two. For example, a low upsell rate paired with a low CES after purchase tells you exactly where to act.
Why this works:
- Low upsell rate = customer behavior (the outcome you’re seeing)
- Low CES = CX signal (the root cause behind that outcome—too much effort, confusing process, etc.)
In short, behavior tells part of the story. Experience metrics tell you how to improve it.
11 Customer Experience Metrics You Should Be Tracking in 2026
If you’re not measuring the appropriate CX metrics, you’re merely speculating about customer needs. That’s a risk you cannot take.
1. Net Promoter Score (NPS)
What it measures
NPS gauges customer loyalty by assessing the probability of a customer recommending your brand.
Why it matters
Loyal customers bring repeat business and cost less to retain. NPS gives you a loyalty pulse in one number.
How to collect it
Inquire with customers: “How likely are you to suggest us to a friend or coworker?” Utilize a 0-10 rating scale.
- 9–10: Promoters
- 7–8: Passives
- 0–6: Detractors
| NPS = % Promoters − % Detractors. |
What action it drives
Use NPS trends to:
- Identify CX champions and brand advocates
- Flag declining loyalty segments
- Prioritize outreach to detractors for recovery
It’s a fast way to measure emotional connection and long-term value.
2. Customer Satisfaction Score (CSAT)
What it measures
CSAT reflects how happy a customer is after a specific interaction.
Why it matters
It gives you immediate feedback on your support performance. High CSAT means your team is resolving issues effectively.
How to collect it
Immediately after a support interaction, ask: “How satisfied were you with this experience?” Make use of a 1–5 or 1–10 scale.
| Calculate CSAT as: (Number of positive responses ÷ Total responses) × 100. |
What action it drives
- Identify high-performing agents
- Spot service bottlenecks
- Adjust workflows in real time
- Use negative CSAT feedback for coaching
CSAT indicates whether you are meeting expectations where it counts the most, after each customer touchpoint.
3. Customer Effort Score (CES)
What it measures
CES measures how easy it is for a customer to get a task done or resolve their problem.
Why it matters
According to DestinationCRM, 62% of customers with high-effort experiences switch to self-service. CES helps you reduce that risk.
How to collect it
Inquire after interaction: “How simple was it to obtain the assistance you required today?” Make use of a 5- or 7-point rating scale (ranging from “Very Hard” to “Very Simple”)
What action it drives
- Simplify complex processes
- Automate repetitive steps
- Reduce unnecessary handoffs
- Identify friction-heavy channels
Low effort means high satisfaction, especially for support interactions where time and clarity matter most.
4. Churn Rate
What it measures
Churn rate shows the percentage of customers who stop doing business with you in a set period.
Why it matters
It directly impacts your revenue and reflects deeper issues in support quality or product experience.
| How to calculate it – Churn Rate = (Customers lost during period ÷ Total customers at start of period) × 100. |
What action it drives
- Improve self-service or onboarding resources
- Determine the causes for abandonment
- Develop focused re-engagement initiatives
- Use churn signals to alert support teams in advance
You can take action before customers exit and your income drops by monitoring churn trends.
5. Customer Lifetime Value (CLV)
What it measures
CLV assesses the overall income a customer generates throughout their association with your business.
Why it matters
CLV allows you to focus on enduring relationships instead of immediate profits. It’s key to understanding profitability per customer.
| How to calculate it – CLV = Average Purchase Value × Purchase Frequency × Customer Lifespan. |
You can adjust this formula based on your business model or segment.
What action it drives
- Segment high-value customers for white-glove service
- Justify higher acquisition costs for high-CLV segments
- Improve onboarding for accounts with potential long-term value
- Use CLV trends to assess CX investment effectiveness
By tracking CLV, you focus your marketing and support on retention, not just volume.
6. Retention Rate
What it measures
Retention rate tracks the percentage of customers you successfully retain over a specific period.
Why it matters
Acquiring a new customer costs five to 25 times more than retaining one (HBR). High retention equals better ROI and predictable growth.
| How to calculate it – Retention Rate = [(Customers at End − New Customers) ÷ Customers at Start] × 100. |
Measure this monthly, quarterly, or annually.
What action it drives
- Analyze drop-off points in the support journey
- Build loyalty programs for long-term users
- Refine onboarding and self-service experiences
- Improve follow-ups after support resolutions
Retention is the best indicator of how well your support and CX efforts actually work.
7. First Contact Resolution (FCR)
What it measures
FCR shows the percentage of customer issues resolved in the first interaction.
Why it matters
FCR is directly linked to customer satisfaction. Customers don’t want to repeat themselves or wait for escalations.
How to collect it
Track ticket resolution logs and customer feedback. You can also ask: “Was your issue resolved in this interaction?”
What action it drives
- Improve agent training to solve queries faster
- Optimize knowledge bases and response templates
- Identify product or process gaps causing repeat contacts
- Reduce average handle time while improving CSAT
High FCR means less friction, faster support, and more satisfied customers.
8. Time to Resolution
What it measures
Time to Resolution tracks how long it takes to fully resolve a customer issue, from first contact to closure.
Why it matters
Slow resolution frustrates customers. Fast issue handling enhances trust and creates a better overall service experience.
| How to calculate it – Average Time to Resolution = Total Resolution Time ÷ Total Resolved Tickets. |
What action it drives
- Identify backlog-causing issues
- Optimize support workflows and escalation paths
- Use automation to route queries to the right teams
- Set benchmarks by issue type and track improvements
This metric reveals how agile and responsive your support system really is, especially under pressure.
9. Customer Sentiment
What it measures
Customer sentiment captures the emotional tone behind customer feedback: positive, negative, or neutral.
Why it matters
It enables you to grasp customers’ emotions, not merely their words. Feeling impacts loyalty and affects brand image.
How to collect or calculate it
Use post-interaction surveys or social media comments. Analyze responses using:
- Natural Language Processing (NLP)
- Sentiment scoring algorithms
- AI-based classification tools
You can also apply text analytics to support tickets and product reviews.
What action it drives
- Detect hidden dissatisfaction in seemingly neutral feedback
- Prioritize follow-ups for negative sentiment
- Adjust the tone of support scripts based on emotional triggers
- Uncover sentiment patterns by channel or product line
Example: A customer rates CSAT high but uses negative language in comments. Sentiment analysis catches that gap before churn sets in.
10. Support Ticket Volume Trends
What it measures
This metric tracks the number of support tickets created over a period: daily, weekly, or monthly.
Why it matters
Ticket volume reveals patterns in product issues, user confusion, or CX breakdowns. It helps you manage support demand proactively.
How to collect or calculate it
Use your helpdesk or Customer Relationship Management (CRM) system to:
- Count new tickets across all channels
- Segment by issue type, location, or product
- Compare volumes month over month
What action it drives
- Forecast staffing needs during peak periods
- Identify recurring issues that require fixes or knowledge-base updates
- Spot anomalies indicating larger system or UX problems
- Detect surges after product updates or outages
A rising ticket trend isn’t always bad, but unexplained spikes should raise flags quickly.
11. Customer Emotional Intensity
What it measures
Customer emotional intensity reflects how strongly customers express emotions, whether frustration, delight, anger, or urgency.
Why it matters
High emotional intensity often signals make-or-break moments in the customer journey. These interactions shape long-term loyalty or churn.
How to collect or calculate it
Apply AI or emotion detection models on:
- Voice tone in calls
- Caps lock, punctuation, and language patterns in chats/emails
- Response length and urgency cues
You can assign intensity scores or flag high-stress interactions for review.
What action it drives
- Escalate emotionally charged cases to experienced agents
- Personalize responses based on emotional state
- Refine chatbot, and IVR flows to reduce agitation
- Utilize emotion-driven segmentation for personalized engagement
Example: A message in uppercase letters with numerous exclamation points indicates immediacy. Give that ticket priority before it gets worse.
How to Measure Customer Experience Across the Customer Journey
Customer experience unfolds across multiple touchpoints. To improve it, you must track the correct metrics at every stage of the journey.
A journey-oriented measurement model provides a clearer understanding of what is effective and what requires improvement. Here’s how to organize it:
1. Awareness & Consideration Stage
This is where prospects form their first impressions. The experience here shapes intent and influences conversions.
Track these metrics:
| 1. Web analytics | Measure bounce rate and session duration to determine content relevance. |
| 2. Sentiment tracking | Employ NLP to track brand references on social media. |
| 3. Chat quality ratings | Evaluate how well website chatbots or live agents engage during research moments. |
Use case: If sentiment dips while traffic grows, your messaging likely misaligns with customer expectations.
2. Purchase & Onboarding Stage
This is the transition from interest to commitment. Friction here can lead to abandoned carts or early churn.
Track these metrics:
| Customer Satisfaction Score (CSAT) | Request feedback immediately after the sale. |
| Onboarding Net Promoter Score (NPS) | Determine how much goodwill the first experience generates for existing consumers to refer new ones. |
| Drop-off rate | Identify at which steps users drop off during the onboarding process. |
Use case: A sudden increase in drop-offs during an onboarding session could support the theory of ambiguous guidance or user interface issues.
3. Usage & Support Stage
As soon as customers begin utilizing your product or service, support becomes vital to their experience.
Track these metrics:
| First Contact Resolution (FCR) | Identify if your team resolves queries in the first interaction. |
| Customer Effort Score (CES) | Evaluate how easy it is for users to get help or complete tasks. |
| Ticket feedback | Collect CSAT results or open comments post-ticket closure to identify service problems. |
Use case: Low FCR and low CES often point to internal knowledge gaps or fragmented support processes.
4. Retention & Advocacy Stage
Content users develop into devoted clients and brand promoters. This is where CX translates to business growth.
Track these metrics:
| Net Promoter Score (NPS) | Monitor long-term loyalty. |
| Referral rate | Measure how often customers recommend you through official referral programs. |
| Review volume & sentiment | Assess how many customers review you on third-party platforms and the opinions expressed in those reviews. |
Use case: When a descending NPS is coupled with descending reviews, something bigger is brewing under the surface.
Centralize Your Journey Metrics in One Place
Tracking these touchpoints manually consumes time and allows for potential gaps. Using a CX software platform such as Kapture CX, you can:
- Unify data across channels into one dashboard
- Automate metric collection by journey stage
- Trigger real-time actions from sentiment or satisfaction drops
- Produce reports that connect customer experience results with business objectives
When your CX metrics are linked, your decisions improve, and your customers remain engaged longer.
Best Practices for Effective CX Measurement
Measuring customer experience is about capturing what matters and acting on it fast. Here’s how you can make your CX measurement efforts truly count:
- Map metrics to key journey stages – Don’t track everything. Determine the key priorities at every interaction: awareness, onboarding, assistance, and retention.
- Combine qualitative and quantitative information – Weigh concrete metrics such as NPS and FCR alongside open-ended comments and call recordings.
- Utilize real-time information instead of monthly reports – Your team requires prompt data to avert churn or address service disruptions. Delayed dashboards won’t cut it anymore.
- Analyze patterns, not just scores – A spike in CSAT may hide a drop in sentiment. Layer insights for context. A single metric seldom reveals the complete picture.
- Evaluate performance against external standards – Establish your personal objectives while also assessing how you measure up to industry benchmarks. This enables you to remain ahead of changing expectations.
- Create closed-loop feedback systems – Ensure frontline teams follow up on negative feedback. Build accountability by connecting metrics to action.
- Avoid metric overload – Don’t drown in dashboards. Concentrate on a select few significant metrics that correspond with business goals.
- Consolidate your data – Utilize a system that unifies feedback from various channels, ensuring your CX perspective remains cohesive.
Effective measurement doesn’t require more metrics. It requires better alignment, speed, and ownership.
Tools and Technologies That Support CX Measurement
CX measurement is a tech-enabled capability. To track experience in real-time, you need a stack that works together.
Here’s what to include in your CX measurement toolkit:
- Survey instruments – Platforms such as Typeform or SurveyMonkey assist in gathering CSAT and NPS at scale. Use them post-purchase or after support interactions.
- NPS and CX platforms – Use platforms like Kapture CX to centralize data from chats, calls, tickets, and surveys. It gives you a unified view of customer experience.
- Sentiment analysis tools – Services such as Medallia or Qualtrics XM employ NLP to identify tone and urgency in open text or voice recordings. They surface hidden frustration early.
- Feedback dashboards – Tools such as Looker or Power BI convert unprocessed feedback into visual insights. Employ filters to identify discrepancies among teams or regions.
- AI-driven notifications – Configure automated alerts for significant changes in metrics. This may include a decline in onboarding NPS or an increase in churn risk.
Why tech matters:
- Eliminates silos between support and marketing
- Speeds up decision-making with instant visibility
- Helps your team personalize CX interventions
- Enables proactive service through predictive insights
With an integrated CX platform like Kapture, you gain more than just metrics; you also gain visibility, speed, and control.
Your Next CX Win Starts with the Right Data
In today’s experience economy, growth follows companies that listen closely, respond quickly, and improve continuously.
You now have the blueprint across journey stages, metrics, and tools. But to truly operationalize CX measurement, you need a platform that brings it all together.
With Kapture CX, you can:
- Consolidate feedback from every channel
- Visualize CX metrics in real time
- Tie service performance to loyalty outcomes
That’s how you move from data collection to customer obsession.
Take the guesswork out of CX. Measure what matters. And let Kapture show you how.
FAQs
CSAT assesses satisfaction following particular interactions. Net Promoter Score (NPS) ascertains overall customer loyalty throughout the customer experience journey.
You should measure CX continuously. However, focus on critical moments such as post-purchase and during onboarding to capture real-time sentiment.
Yes. With the right tools and a focused set of metrics, even small teams can build impactful CX measurement systems that drive growth.
