Every customer interaction leaves behind data.
But without the right lens, that data doesn’t say much. Performance analytics gives businesses that lens. It connects numbers to real behaviors, showing what works and where customers start to drop off.
This is a very useful insight for CX teams. It makes it easier to trace the customer experience more precisely and shows how satisfaction is impacted at every stage, from awareness to assistance.
It’s no surprise then that performance analytics is gaining serious ground.
The global market for these tools was valued at USD 4.20 billion in 2024, and it’s expected to reach USD 16.37 billion by 2033, growing at a CAGR of 15.51%, according to IMARC Group. The growth reflects one clear trend: companies are betting on data-driven insights to measure performance and to make every customer experience better and more consistent.
Key Components of Performance Analytics
When done right, performance analytics gives CX teams something they rarely have: clarity. It cuts through scattered reports and anecdotal feedback to show what’s actually driving (or hurting) customer experience. That clarity comes from a few key components working together. These include:
1. Metrics and KPIs
Teams’ interpretations of performance are directly impacted by the metrics they choose. Net Promoter Score (NPS), Customer Satisfaction (CSAT), and Customer Effort Score (CES) are examples of customer-focused KPIs that assess sentiment but ignore the operational causes of such outcomes.
CX teams use operational analytics such as agent performance indicators and first-contact resolution rate to understand why ratings vary.
The real value lies in connecting these dots. A short resolution time isn’t a win if customers still leave frustrated. The goal should be to pair speed with satisfaction.
2. Data Collection
How well your analytics perform depends on how connected and clear your data is. The primary sources of CX data are CRM logs, helpdesk information, post-interaction surveys, and touchpoints throughout the customer journey.
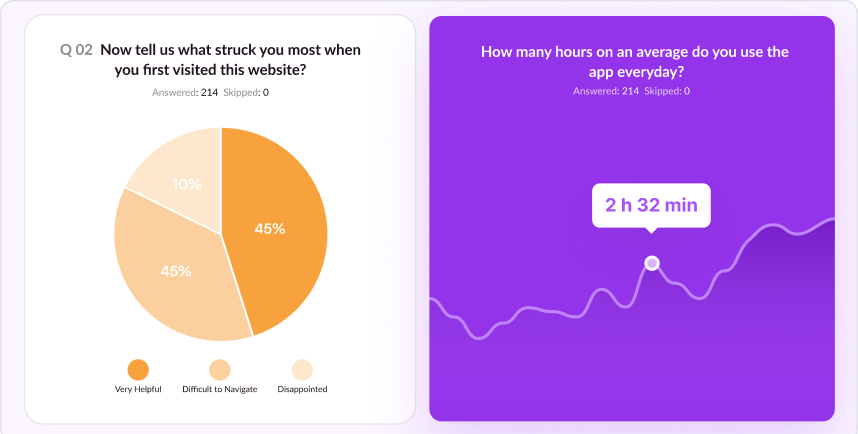
The ability to combine those signals, ensuring that a chat complaint is not isolated from survey replies or previous purchases, is what sets great teams apart.
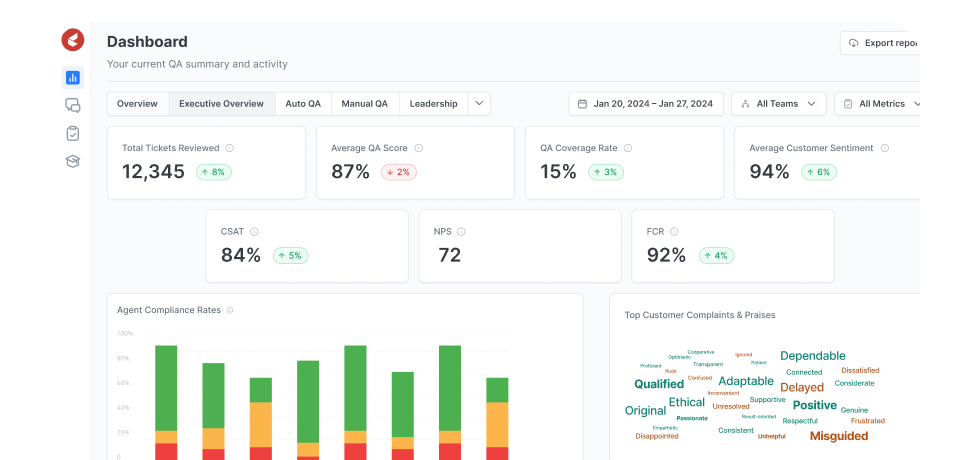
3. Visualization and Dashboards
Dashboards have undergone a considerable transition from being stationary scorecards to becoming lively decision-making interfaces.
A proper visualization layer connects KPIs to the ongoing activities by bringing notice to the anomalies in the response times, sentiments, or engagements through the slow-downs taking place.
The CX leaders can see these insights at any time and change the procedures for customer experience problems or displeasure to be converted into escalation, thus, making service delivery smoother and more efficient via data.
4. AI and Predictive Analytics
The actual change takes place when analytics start to see the future instead of the past.
Predictive models that are based on past trends can estimate the probability of customer churn; meanwhile, AI-facilitated sentiment analysis and anomaly detection bring to light the behavioral cues that were previously unnoticed.
Summary
| Component | Benefit | CX Impact |
| Metrics | Aligns operational efficiency with experience quality | Creates measurable links between service actions and customer outcomes |
| Data Collection | Integrates structured and unstructured customer data | Reveals friction points across the journey |
| Visualization and Dashboards | Turns complex data into contextual insights | Faster and evidence-based CX decisions |
| AI and Predictive Analytics | Anticipates behavior and service needs | Personalization and preventive CX strategies |
Linking Performance Analytics to the Customer Journey and Driving CX Benefits
When performance analytics is connected to the customer journey, it becomes genuinely useful. Analysis of the data produced by each touchpoint shows how experiences affect loyalty.
Organizations may determine precisely where interventions will have the greatest impact by matching analytics to journey stages.
1. Awareness and Consideration
At this stage, analytics helps teams see how potential customers first interact with a brand. For instance, analyzing the relationship between ad engagement and landing page exits can help determine whether the messaging resonates or causes confusion.
Marketing and CX teams use these insights to understand what actually converts interest into intent.
2. Purchase and Onboarding
During conversion, analytics shifts focus to experience flow. Metrics such as completion rates, failed transactions, and time-to-activation reveal where customers struggle.
A delay in onboarding emails or complex payment steps might not look major in isolation, but analytics makes their cumulative effect visible. That visibility lets teams redesign friction-heavy steps before they turn into complaints.
3. Post-Purchase Support
In this case, analytics transforms reactive care into preventative treatment. CX teams can track trends, such as longer resolution times, recurring complaints from a product line, or more agent handoffs, and take action before they become more serious rather than waiting for dissatisfaction to manifest.
Even clients exhibiting early indications of disengagement can be identified by predictive algorithms.
4. Feedback Loop
The journey doesn’t end at support. Performance analytics keeps feeding customer feedback and NPS trends back into the system. Over time, this loop helps teams distinguish between one-off incidents and systemic gaps. Therefore, shaping the ultimate CX strategy for your brand or business.
Steps and Best Practices for Implementing Performance Analytics Effectively
Performance analytics can transform customer experience operations but only if implemented with clear intent and structure. Many CX teams collect large volumes of data but struggle to turn it into action.
A good implementation plan bridges that gap.
1. Start with Business Goals, Not Dashboards
The first mistake many teams make is jumping straight into tools. Before setting up any analytics platform, define the why. Are you trying to reduce resolution time? Improve onboarding? Increase renewal rates?
Every indicator you monitor ought to be directly related to a quantifiable corporate objective. For instance, your analytics should track backlog trends, agent occupancy, queue wait times, and other metrics if your objective is to reduce response times by x%. This goal-first methodology maintains analytics’ relevance and emphasis.
2. Map the Data Journey
Identify every point of contact where customer data resides, such as CRM systems, ticketing platforms, chat logs, call recordings, survey tools, or social channels. Audit what’s being tracked and what’s missing. Next, standardize your data formats using data science to structure, clean, and integrate information across systems.
Standardize your data formats next. Many CX leaders integrate data pipelines using tools like Power BI or Tableau to bring everything into one unified view. This reduces reporting errors and gives teams a single source of truth.
3. Choose Actionable Metrics
Avoid vanity metrics. High-level metrics that don’t provide anything about performance quality include “total tickets handled” and “website traffic.” Instead, concentrate on data that drive action like first-contact resolution rate and changes in customer sentiment over time.
Each metric should answer one key question: What decision can this data help me make tomorrow? If it doesn’t, it’s not worth tracking.
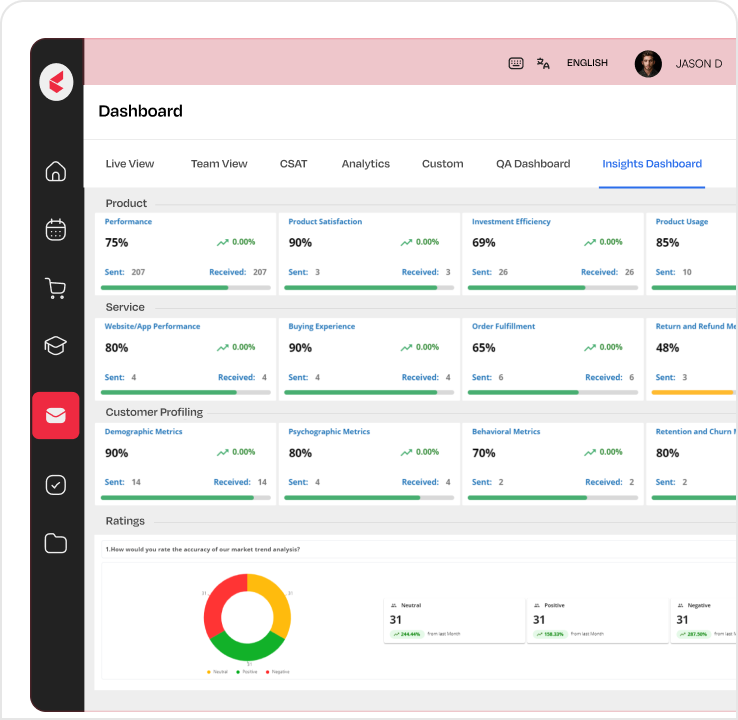
4. Build Real-Time Visibility
Static reports lose value fast in constantly changing CX environments. That’s why it’s important to invest in live dashboards that show queue status and customer sentiment in real time.
For example, if escalations spike during a product launch, managers should see it immediately and reallocate resources. Platforms like Kapture CX make this level of visibility possible without heavy IT involvement.
5. Close the Loop with Insights
Analytics is all about response. Build a cadence for reviewing insights. Weekly or biweekly performance reviews with front-line supervisors help translate numbers into changes like retraining agents, adjusting workflows, updating knowledge bases, and more.
Mini Checklist
- Define clear outcomes. Know exactly what business goal each metric supports.
- Examine each touchpoint and eliminate any duplicate or blind data.
- Pay attention to KPIs that can be used to make judgments.
- Centralize all client data.
- Enable real-time monitoring to identify and address issues as they arise.
- Complete the feedback loop and transform observations into ongoing operational enhancements.
Common Challenges in Performance Analytics
Even with advanced tools, performance analytics can be difficult to execute well.
- The first major challenge is fragmented data, which we have talked about earlier as well. Customer data is frequently stored in spreadsheets, CRM systems, ticketing tools, marketing automation platforms, etc. The quality of decisions is compromised because analytics teams spend more time reconciling sources than evaluating insights due to the lack of integration.
- Another persistent problem is the quality of the data. Outdated records, incorrect categorization, or incomplete entries skew trends and produce false conclusions. Maintaining accuracy requires regular governance regulations and data audits.
- Metric saturation is another issue that organizations face. Too much KPI tracking blurs priorities and weakens focus. A core set of KPIs, such as retention, satisfaction, or resolution time, that are directly related to business results must be agreed upon by teams.
- The cultural shift is equally important. Analytics adoption depends on whether employees trust the data and see its value in daily decisions. Dashboards remain unused without clear communication and executive support.
- Lastly, scalability becomes complex as data volume grows. Without strong cloud infrastructure and automation, latency and storage issues start to erode the speed and reliability of insights.
#Pro tip: Start small by mapping analytics to one stage of the customer journey. Once the framework delivers measurable value, extend it across departments for sustainable adoption and data consistency.
Growing Trends in Performance Analytics
Performance analytics is entering a new phase, driven by AI, embedded BI, and unified data systems.
Salesforce’s momentum around Data Cloud and its artificial intelligence tools is a major signal. In its fiscal 2025, Salesforce reported $900 million in annual recurring revenue from its Data Cloud and AI products. This means that companies are investing heavily in infrastructure that supports real-time analytics and predictive insights.
Another trend comes from Salesforce’s push for more agentic tools. Tools that do more than assist, they act. Agentforce, its AI agent offering, reflects this shift toward automation of tasks that once required human operator intervention.
Also, unified or “Customer 360”-type views continue to gain importance. Teams want data from all channels, be it marketing, service, or commerce, aggregated so insights are coherent and immediately actionable.
The performance analytics market itself is expanding rapidly. One report estimates a CAGR of 14.5-14.7% between 2024 and 2029, with market size rising from $4.95B in 2024 to $9.75B by 2029.
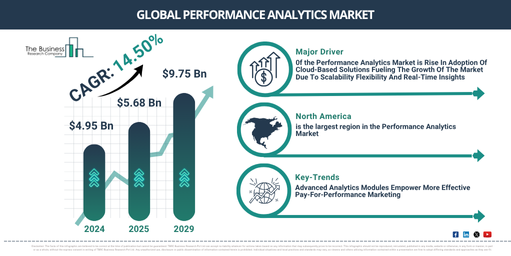
Source: The Business Research Company
These trends suggest analytics is moving toward immediacy and intelligence, not just dashboards, but prediction, action, and embedded insights in daily workflows.
Conclusion: Driving CX Excellence with Performance Analytics
When data drives behavioral change as much as process optimization, CX excellence is revealed. Managers can use it to spot new trends and foresee client needs before they become more urgent.
Additionally, the most prosperous companies integrate organizational alignment with analytics. Data alone does not change outcomes; people do. Teams must be trained to interpret insights correctly and empowered to act on them quickly.
Looking ahead, performance analytics will increasingly intersect with AI and automation to create “intelligent workflows.” In this environment, CX excellence is measured less by isolated KPIs and more by the organization’s ability to adapt, iterate, and respond in real time.
Take control of every customer interaction with Kapture Insights. Automatically assess quality and compliance, flag issues instantly, and coach agents in real time. Turn feedback into action within minutes and speed up resolution. Accelerate onboarding and keep teams engaged, all while improving performance and cutting turnover.
Book a demo today to know more!
FAQs
Teams can anticipate client demands and churn risk by leveraging performance analytics to identify patterns in previous encounters. As a result, companies may prioritize proactive engagement tactics.
Indeed. Analytics facilitates better goal alignment and action coordination among marketing, support, and sales teams by offering a single source of truth for customer data.
By identifying individual and team performance gaps, analytics facilitates individualized training plans and the identification of high-performing agents, all of which increase engagement and lower turnover.