84% of organizations working to improve customer service report an increase in revenue.
After a positive customer experience, 69% would recommend the company to others.
75% of people would return to a company with excellent service.
55% of customers become a customer of a company because of its reputation for excellent customer service. – source
The statistics indicate that customer service is imperative to the success of any business both in terms of revenue generation and customer retention.
Hence, there is a great value in tracking the customer service KPIs, since it provides invaluable insights into how a business is meeting its customer service and revenue targets.
What are Customer Service KPIs?
Customer service KPIs are tools used to set, measure, and evaluate the performance goals of the organization in customer service. Measuring the KPIs is imperative to motivating the employees to keep up with the service standards and business objectives.
Why are Customer Service Metrics Important?
Tracking and measuring are fundamental to knowing what works and what doesn’t so that you can put the wrong things in order and keep doing the right things right. And, for customer service, the pieces of information and insights gathered by the metrics and KPIs tell you how well your customer service process is functioning.
Measuring Customer Service Metrics is important because it tells you,
- How well your customer service process/agents are performing
- Whether you can meet the organizational goals/customer needs
- Reasons behind your current standing
- Judge the success/failure of your actions
Fundamentally, we are taking the guesswork out of our business by intending to track the metrics and KPIs for customer service.
Key Customer Service Metrics and KPIs
However impalpable the customer’s emotions, suggestions, and frame of mind may seem to measure, there are metrics and KPIs that can come to your aid. They let you measure the success of customer service by measuring the efficiency of the service representatives and the satisfaction of customers.
Here, it is as well relevant to not confine yourself to one or two metrics while evaluating the performance of your customer service team. The more metrics you track the more aspects of your operations you measure ultimately allowing you to achieve the strategic goals faster.
For this reason, we have picked all the key customer service performance indicators that will help you understand your customer service better and find room for continuous improvement. Read to find out what they measure and how it matters.
1. Average Handle Time
Average Handle Time measures the time spent on a ticket by the agent. It is measured from the time an agent opens the email to the time the agent clicks the send button.
Best Practice:
Check what is slowing down your team when the Average Handle Time is on the higher end. Providing self-help resources as well as training agents on requisite areas can help you reduce the handling time.
2. First Contact Resolution
First Contact Resolution, FCR is the percentage of service tickets that are resolved on the very first call/contact.
FCR indicates how efficient your service agents are at resolving the issue in the first contact. As for the best scenario, it is never a good practice to transfer the customer to another agent or have them email you a second and a third time.
Best Practice:
Maintaining a database of verified and proven replies or solutions to customer queries helps you bring down the FCR rate. Shooting canned responses, the pre-packed messages that you insert into messages as and when needed mostly help you accomplish ticket resolutions in the first contact.
3. Customer Satisfaction Score
The Customer Satisfaction Score or CSAT defines how happy customers are after a service experience. The customer’s opinion post service is collected through surveys and directly reflects how well the complaints and customer queries are handled by the customer service representatives.
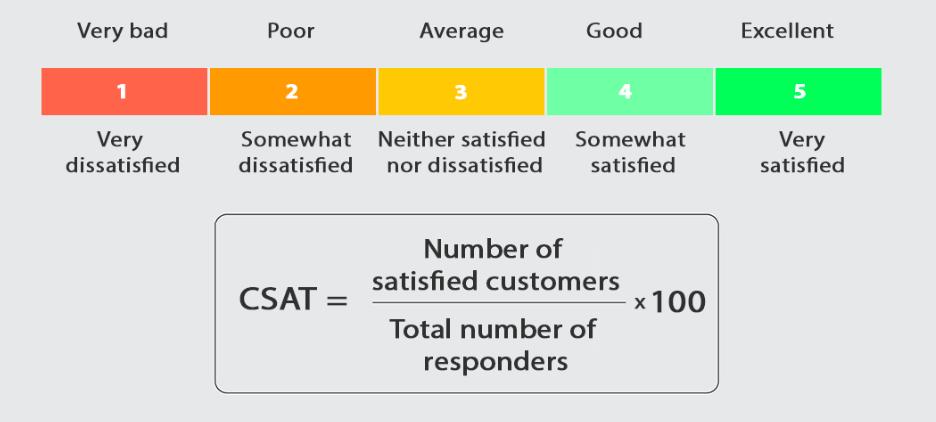
To measure CSAT, you ask your customers to rate your product/service on a 5-star rating scale. Divide the sum of positive responses (somewhat satisfied and very satisfied) by the total number of responses and multiply by 100.
Best Practice:
The CSAT rating scale range can be more than 5 but smaller scales are effective. Additionally, make sure the survey is easy to fill out and the wordings in the question are clear-cut. Utilize them to measure customer satisfaction levels at key stages throughout the customer journey. The key stages, for instance, could be as soon as they have made a purchase, canceled an order, or interacted with your service agent. Kapture, a customer service automation platform enables you to schedule automatic surveys to go out via email, SMS, or app at key touch points.
4. Number of Issues
The number of tickets logged into the help desk system gives you the number of issues. Knowing this helps you plan your staffing needs, identify times of spike in the number of issues, or draw your attention to product quality issues. You can also tally the number of issues logged per service channel, allowing you to allocate more agents on channels with heavy traffic.
Best Practice:
Providing self-service options to customers such as chatbots, self-help portals or discussion forums can help drastically reduce the number of service tickets.
5. Tickets per customer
It is the total number of tickets in a given period divided by the number of customers supported by the service desk. A high number of tickets per user indicates that many customers are awaiting the service.
Best Practice:
Automation of ticket routing, canned responses, and enabling self-service are some excellent ways to reduce the number of tickets per customer.
6. Number of Resolved Tickets
The number of resolved tickets is the number of tickets received by an agent or team and resolved within the given period. If the number of tickets resolved in a single day is far less than the number received could mean that the resolution of customer issues may be delayed.
Looking at this metric over a period of time can give you knowledge of agent performance, or the time when the ticket volume goes up. You can now make vital decisions such as setting up training for underperforming staff or balancing staff requirements to swim in the peak season tide.
Best Practice:
The best way to use these metrics is to view the metric in combination with the number of received and unresolved tickets. This will help you identify the spike in unresolved tickets in a day and associate it with a cause/issue.
7. Net Promoter Score
Net Promoter Score or NPS measures how likely your customers are to recommend your product or service to their friends and family on a scale of 1 to 10.
You can categorize the respondents into three groups based on how they have rated you.
- Promoters: (9-10)
- Passives: (7-8)
- Detractors: (0-6)
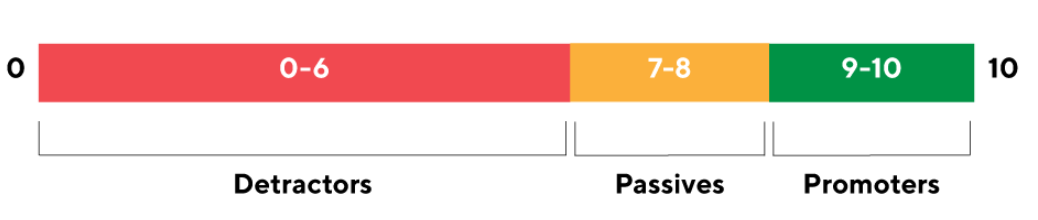
To calculate the NPS score, subtract the percentage of promoters from the detractors.
Higher scores indicate stronger relationships with customers whereas lower scores indicate you need to invest in your customer satisfaction and loyalty.
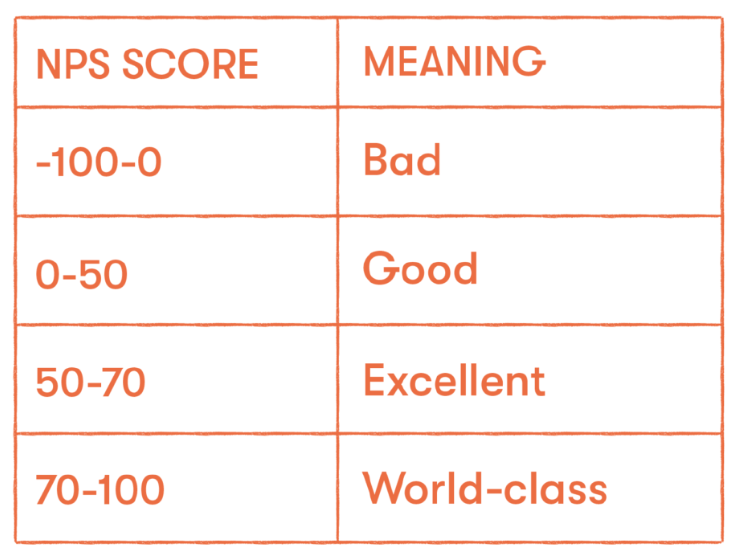
Image: What is a good NPS score?
Best Practice:
You can run an NPS survey through email questionnaires or in-app reviews. Once you run the survey, compare it against the benchmarked values. Note that NPS can vary by industry, region, or other characteristics such as customer’s income level, or time with your organization.
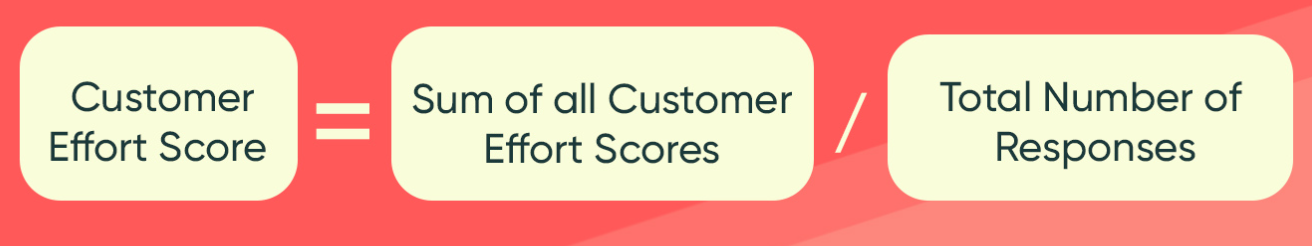
8. Customer Effort Score
The Customer Effort Score, CES measures how easy it is for the customer to accomplish a particular task (such as resolving issues or making a purchase). Asking the customer, “How easy was it for you to get your question answered?”, for instance, on a scale of 1-7 helps you understand whether you should improve your services.
The CES score reveals how easy it is to do business with you and how competent, feasible, and befitting your product is to serve its intended purpose.
Best Practice:
Delivering an omnichannel experience to customers helps them contact you through any channel they prefer as well as enables you to resolve their queries across any channel without losing context.
9. Customer Retention Rate
Customer Retention Rate refers to your organization’s ability to retain a paying customer over a given period (annually, monthly or weekly).
Formula:
Customer Retention Rate = ((CE – CN) / CS)) x 100
where,
CE is the number of customers at end of the period,
CN is the number of new customers acquired during the period and,
CS is the number of customers at the start of the period.
Measuring the customer retention rate is so important because the cost of acquiring new customers is 5 times higher than that of retaining customers. So you need to know how many of your customers continue to stay with you as they are the money-spinners largely contributing to the profits you expect to garner.
Best Practice:
A positive brand image and higher customer satisfaction levels have a direct impact on customer retention rates. Therefore, adopt ways to improve customer satisfaction levels through loyalty or reward programs and better customer service.
It is worth noting how one of the most popular eCommerce businesses, Uber, keeps an eye on improving its customer retention through the Uber rewards program.

Image: Uber’s Reward Program
10. Net Retention Rate
The Net Retention Rate, NRR refers to the revenue generated by the current customers taking into account churn and downgrades.
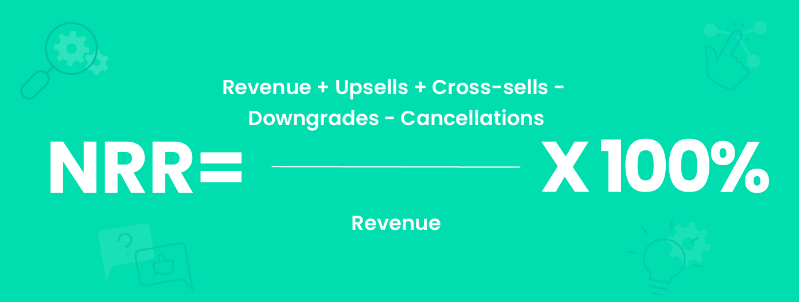
Image: Formula – Net Retention Rate
As shown in the formula, sum the revenue, upsells, and cross-sells; detect the downgrades and subscription/service cancellations; divide by revenue and multiply by 100.
Best Practice:
Monitor NRR on a monthly and annual basis to keep an eye on revenue.
When NRR>100%, your business generates more income from current customers to compensate for the revenue loss incurred due to customer churn.
When NRR<100%, signals a red alert that you are losing revenue.
11. Customer Churn
Customer churn happens when your customers stop using your product/service. Factors such as declining repeat purchases, customer satisfaction, and experience scores can give insights into impending chances of churn. Likewise, the detractors in an NPS survey have an increased probability of churning. In customer churn, you look at the number of customers lost in contrast to the customer retention rate where you look at the number of customers retained.
Best Practice:
Modern analytics systems enable preventative methods that help in detecting customer churn, as opposed to earlier periods when you could only record the churn when customers actually left. Improved customer onboarding, active customer engagement with your product/service, sending quick responses to their queries, and offering incentives, and long-term contracts are tips to prevent customer churn.
12. Top Support Agents
Top support agents can be tracked by considering the number of tickets resolved, First contact resolution rate, Average Handle Time, Customer Satisfaction Score, and more.
Best Practice:
Identifying the top-performing service agent and motivating them to perform against a benchmark keeps healthy competition running in your team while also letting you track down underachievers.
13. Support Costs Vs Revenue
Every business aims to offer the finest quality service at reasonable rates. And that’s why you track the support cost against revenue. Doing so would help in assessing what percentage of the total revenue the customer service account to.
Best Practice:
To have a precise understanding of this, simply find out the cost per resolution as given below.
14. Cost Per Resolution
It is a simple yet very effective metric that lets you improve service desk efficiency and customer satisfaction. To find the cost per resolution divide the total support costs by the total number of tickets.
Analyze the cost per ticket in association with the customer satisfaction help you gain insights such as,
- A high customer satisfaction rate for a terribly high cost per ticket.
- The customer satisfaction is not as expected considering the high cost per ticket.
- Above-average customer satisfaction for a reasonable cost per ticket.
Best Practice:
Well-trained agents coupled with excellent technology help keep the support costs low while at the same time delivering superior customer service and raising customer satisfaction levels.
How to Improve Your Customer Service KPI Metrics?
The customer service teams grapple with challenges such as ticket backlogs, angry customers, and of course the deadlines and pressure to meet the KPIs. Inefficiencies at the workplace can be eliminated by adopting practices to improve workplace productivity, allowing agents to accomplish more in a shorter time, thus improving the KPIs.
Below are some tips on how to improve the customer support KPI metrics through enhanced workplace productivity.
- Empower Agents
Technology helps deliver intelligent customer service and holds the answers to improve your metrics.
Chatbots: A great feature to assist your customers with their queries by providing human-like interaction.
Virtual Agent: Helps the service agents by recommending contextual solutions, the next-best answers, and course of action to their questions.
Knowledge Base: A repository of information, that provides every staff access to knowledge. Maintains information such as FAQs and video tutorials to be accessed by customers or staff. Training modules included in the knowledge base can be used by the staff to upskill and refresh their knowledge.
Canned Responses: It saves a great deal of time in that you do not have to type the same reply time after time. Create canned or prewritten responses for email, chat, or SMS and reply to customers’ questions without any delay.
- Automate Tasks
Automate all the tasks from ticket creation to its closure. Automatically routing the service ticket to the appropriate agent based on his skill’s proficiency level/region/availability leads to faster resolution of queries.
The latest help desk solutions let the agents collaborate with third parties or team members with regard to a ticket without losing the context.
With these solutions, sharing automated surveys after service interactions or other touchpoints can all very well be customized according to the business needs. You can also set up triggers and alerts on the tickets to rigorously follow the tickets to closure.
Smart automation of workflows boosts the KPIs such as Average Handling Time, and the number of tickets resolved thereby positively impacting customer satisfaction.
- Omnichannel Customer Service
Switching applications and channels to manage customer queries is a time-intensive process. An omnichannel help desk solution consolidates customer conversations from different channels into a single inbox. This improves the agent-customer engagement levels as agents have ample context gained from extensive customer data that are maintained at a single location.
Measure and Manage your Business with Intelligent Automation and Customer Support
1000+ businesses use Kapture, a customer service automation platform, to delight their customers with fast and intelligent support. With Kapture, automate sending of surveys such as NPS, CSAT, or customized survey forms to gather customer feedback. Our intuitive dashboard offers an end-to-end view of agent performance, service tickets, and other vital customer support KPIs.
Kapture’s help desk ticketing system, self-service tools, knowledge base, and contact center serve as an excellent medium for delivering reliable customer service.
What’s more, our robust reporting, and analytics tool offer curated reports to track the critical metrics. So start building the customer experience that gives you fine KPIs for customer service and takes your business to new heights.
About the Author | |
 | Seema C Mohan |
| Seema C Mohan is passionate about all things XaaS and loves to write value-added content. She has been in Business Process Management in the past and has published technology articles in journals. | |
,
,
,
,
,
,
,
,
,
,
,
,
,